Solutions
Data analytics for circular packaging systems
Bring packaging, scan and operational data together so you can see what your reuse system actually costs — and what it actually saves.
How it works
Reath sits on top of your existing systems and turns scattered packaging data into a single, trustworthy analytics layer.
Integrate
Connect ERP, WMS, scanning apps and supplier spreadsheets through our API and importers.
Automate
Validation rules clean the data as it arrives, so reporting stops being a manual reconciliation job.
Monitor
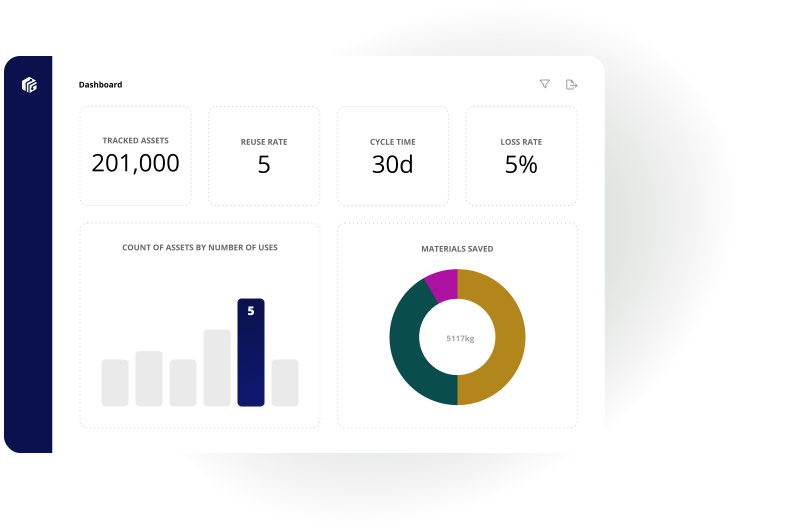
Dashboards for reuse rates, cycle times, loss rates, cost per use, carbon and EPR exposure.
Optimise
Model changes to pool size, routes or formats and see the impact before you commit.
Use cases
The same data set answers finance, operations and sustainability questions — without three separate spreadsheets.
Prove the business case
Compare real cost per use against single-use alternatives, including logistics, washing and losses.
Break even points stop being a guess once you have cycle data.
Report with confidence
Export regulator-ready and board-ready reporting on packaging volumes, reuse rates and emissions.
Find the losses
Segment loss and dwell time by site, route and customer to target the small number of causes driving most of the cost.
Share with partners
Give manufacturers, logistics and washing partners the slice of data they need — and nothing more.
See your packaging data in one place
Book a demo and we'll show you the dashboards using a system like yours.